|
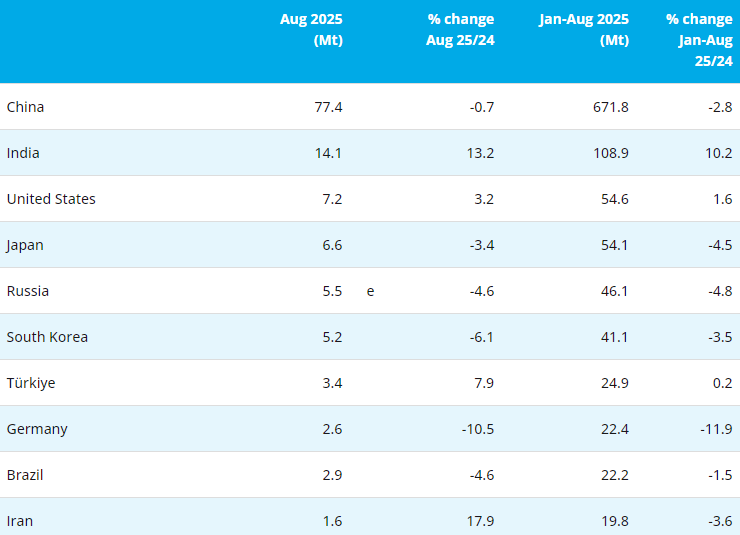
Top 10 steel-producing countries |
||||
|
Rank |
Country |
2019 (Mt) |
2018 (Mt) |
%2019/2018 |
|
1 |
China |
996.3 |
920.0 |
8.3 |
|
2 |
India |
111.2 |
109.3 |
1.8 |
|
3 |
Japan |
99.3 |
104.3 |
-4.8 |
|
4 |
United States |
87.9 |
86.6 |
1.5 |
|
5 |
Russia (e) |
71.6 |
72.0 |
-0.7 |
|
6 |
South Korea |
71.4 |
72.5 |
-1.4 |
|
7 |
Germany (e) |
39.7 |
42.4 |
-6.5 |
|
8 |
Turkey |
33.7 |
37.3 |
-9.6 |
|
9 |
Brazil |
32.2 |
35.4 |
-9.0 |
|
10 |
Iran (e) (1) |
31.9 |
24.5 |
30.1 |
(e) - annual figure estimated using partial data or non-worldsteel resources.
(1) 2018 and 2019 data have not been collected on the same basis, so % change is not directly comparable.
(World Steel Association)

- [Editor:kangmingfei]


 Save
Save Print
Print Daily News
 Research
 Magazine
 Company Database
 Customized Database
 Conferences
 Advertisement
 Trade
Trade


Tell Us What You Think