

 Save
Save Print
PrintMolybdenum (Mo) is used mostly in steels and superalloys to enhance strength, toughness, thermal and corrosion resistance, and to reduce brittleness. Applications include high speed steels, stainless steels (especially to increase corrosion resistance), high temperature steels and in cast iron. It is used also in nickel, titanium and molybdenum base alloys for applications requiring high strength and stability at high temperatures such as heating elements, radiation shields, glass melting equipment and in jet and rocket engines. Other uses include as catalysts, lubricants and pigments, as well as applications in the electronics industry and as trace nutrients in fertilisers. The main commercial source of molybdenum is the mineral molybdenite (MoS2) but it is found also in minerals such as wulfenite (PbMoO4) and powellite (CaMoO4). Molybdenum is mined as a principal ore but is more commonly recovered as a by-product or co-product from copper and tungsten mining.
Molybdenum
Resources
Australia’s Economic Demonstrated Resources (EDR) of molybdenum increased from 167 kilotonnes (kt) in 2011 to 203 kt in 2012. This increase results from a large increase in resources at Dart Mining’s Unicorn deposit in Victoria. Resource figures for Australia’s EDR do not include 220 kt of reserves at the Spinifex Ridge Molybdenum-Copper Project deposit in Western Australia (WA) which the owner, Moly Mines Limited, indicates is currently uneconomic and, as a consequence, has been reclassified as Paramarginal. Spinifex Ridge is Australia’s largest molybdenum deposit. The majority of Australia’s EDR is in Queensland (Qld) with 70.5%, followed by Victoria (Vic) with about 25%. If the Spinifex Ridge resources are included in the EDR, the overall resources would be 52% in WA, followed by Qld (34%) and Vic (12%).
Australia’s Subeconomic Demonstrated Resources (SDR) accounted for about 86% of the total Demonstrated Resources, with 75% of SDR in Qld and the remainder in WA. In 2012, Paramarginal Resources and Submarginal Resources stood at 1220 kt and 0.5 kt respectively, which is unchanged from 2011.
Inferred Resources of molybdenum increased only slightly from 562 kt in 2011 to 572 kt in 2012. Queensland and WA account for 66% and 28% of Inferred Resources respectively.
Accessible EDR
All of Australia’s known EDR of molybdenum is accessible.
JORC Reserves
Joint Ore Reserve Committee (JORC) Code reserves comprise total molybdenum in Proved and Probable Ore Reserves as defined in the JORC Code. In 2012, JORC Code reserves of 79.5 kt accounted for approximately 39% of Accessible Economic Demonstrated Resources (AEDR). Nearly all these reserves (about 77.4 kt) are from Inova Resources’ Merlin Project in northwest Qld. The 2012 figures do not include 220 kt of reserves from the Spinifex Ridge Molybdenum-Copper Project deposit in WA, which, as reported by Moly Mines Ltd, are uneconomic at the current molybdenum prices.
Exploration
Data on exploration expenditure for molybdenum are not available nationally.
Production
There was no recorded molybdenum production in Australia in 2012.
World Ranking
According to United States Geological Survey (USGS) data, updated by Geoscience Australia for Australia’s resources, world economic resources of molybdenum in 2012 are estimated to be about 11 200 kt with China holding about 38% of the resources followed by the USA with 24% and Chile with 21%. Australia accounts for around 1.8% of the world’s economic resources of molybdenum.
The USGS estimates that world molybdenum production in 2012 amounted to 252 kt, slightly lower than its revised 2011 figures of 264 kt. China, the USA, Chile and Peru accounted for about 87% of global outputs in 2012 with China producing 105 kt, followed by the USA with 57 kt, Chile with 35 kt and Peru with 19.5 kt.
- [Editor:Yueleilei]
 Daily News
 Research
 Magazine
 Company Database
 Customized Database
 Conferences
 Advertisement
 Trade
Trade


.jpg)


 Online inquiry
 Contact
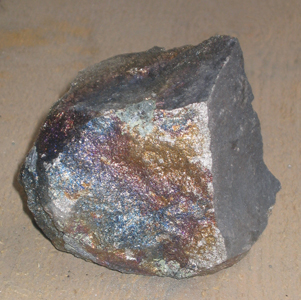


Tell Us What You Think