[Fellow]Australia’s Economic Demonstrated Resources (EDR) are estimated to be 60 kilotonnes (kt) of tantalum in 2012, a 3% decrease on 2011 resource of 62 kt. Of these 85% are in WA and 15% in NSW. More than 94% of the EDR in WA are associated with Global Advanced Me...
Tantalum
The main use of tantalum (Ta) is in the manufacture of capacitors required for the electronics and telecommunications industries. Because they are small and have high reliability, these capacitors are used in miniaturised electronic circuits, mainly in mobile phones. Because of its anti-corrosive properties, tantalum metal is used in the chemical industry in applications such as tantalum carbide in tools for metal cutting and machining, as well as in metal alloys in the aerospace and electricity-generating industries. Overall, approximately 60% of annual world consumption of tantalum is used in the electronics industry, with more than half used in the manufacture of mobile phones.
Tantalum minerals have more than 70 different chemical compositions, of which tantalite [(Fe,Mn)Ta2O6], microlite (CaTa2O6), and wodginite [Mn(Sn,Ta)(Ta,Nb)2O8] are of greatest economic importance. It is common practice to name any mineral concentrate containing tantalum as tantalite.
Australia has historically been the world’s largest producer of tantalum (as tantalite concentrates), providing approximately half of the world’s mine output through mining operations at Greenbushes 250 kilometres (km) south of Perth in Western Australia (WA) and at Wodgina 100 km south of Port Hedland, WA.
Resources
In WA, granitic rare-metal pegmatites are the dominant host rock for primary tantalum mineralisation. The only exceptions are the carbonatite type deposit at Mount Weld in the eastern goldfields of WA and an unusual form of subalkaline granite-syenite mineralisation at the Hastings (also known as Brockman-Hastings) deposit, southeast of Halls Creek, WA. High-graded tantalum mineralisation is also found in a trachyte body at the Toongi deposit (also known as Dubbo Zirconia Project) in New South Wales (NSW).
Australia’s Economic Demonstrated Resources (EDR) are estimated to be 60 kilotonnes (kt) of tantalum in 2012, a 3% decrease on 2011 resource of 62 kt. Of these 85% are in WA and 15% in NSW. More than 94% of the EDR in WA are associated with Global Advanced Metals’ (formerly Talison Tantalum) Greenbushes and Wodgina deposits. The remaining EDR in WA occurs at the Mount Cattlin, Mount Deans, Dalgaranga, and Arthur River deposits. In NSW, all the EDR are associated with the Toongi deposit.
The Greenbushes pegmatite deposit is located approximately 250 km south of Perth, in southwest WA. The deposit is known to contain one of the world’s largest hard rock tantalum resources. No new tantalum resources have been reported since October 2011. Hastings Rare Metals deposit (now known as Hastings Rare Earth, Zirconium, Niobium deposit), which is owned by Hastings Rare Metals Limited, is located 18 km southeast of Halls Creek, WA. It is hosted by a fine-grained volcaniclastic unit (informally known as the Niobium Tuff) within a sequence of thick volcanic-sedimentary rocks. The Niobium Tuff can be traced over a strike length of 3.5 km and varies in width up to 35 metres. The last update of Joint Ore Reserve Committee (JORC) Code compliant resource was reported in September 2011.
The Toongi deposit, 20 km south of Dubbo in NSW accounts for 15% of tantalum EDR. The deposit is a sub-volcanic intrusive trachyte body (vertical) with dimensions of approximately 900 metres by 600 metres and containing a Measured Resource of 35.7 million tonnes (Mt) grading 0.03% Ta2O5, and an Inferred Resource of 37.5 Mt grading 0.03% Ta2O5.
Alkane Resources reported the presence of mineralisation at the neighbouring Railway prospect 4 km northwest of the Toongi orebody, where reverse circulation drilling in the trachyte body intersected a zone containing grades ranging from 0.85% to 0.99% ZrO2, 0.21% to 0.23% HfO2, 0.21% to 0.26% Nb2O5, 0.013% to 0.15% Ta2O5 and 0.43% to 0.48% TREO (Y2O3 + REO). The report notes that there has been insufficient exploration of the Railway trachyte to define a mineral resource and it is uncertain that further exploration will result in the determination of a mineral resource.
Subeconomic Demonstrated Resources account for about 31% of total Demonstrated Resources. The Paramarginal and Submarginal Resources amount to 18 kt, showing no increase on 2011. Western Australia is the largest holder of Paramarginal Resources with 61% followed by NSW with 39%. All the Submarginal Resources occur in WA.
Inferred Resources totalled 21 kt and did not change from Inferred Resources reported for 2011. Western Australia and NSW account for 68% and 32% of Inferred Resources respectively.
Accessible EDR
All of Australia’s EDR of niobium is accessible.
JORC Reserves
The Joint Ore Reserve Committee (JORC) Code reserves comprise total tantalum in Proved and Probable Ore Reserves as defined in the JORC Code. In 2012, JORC Code reserves of 29 kt accounted for approximately 48% of Accessible Economic Demonstrated Resources (AEDR).
Exploration
Data on exploration expenditure for tantalum are not available.
Production
Western Australian Department of Mines and Petroleum did not report tantalum production figures for 2012. However it announced a combined production in dollar values of tin, tantalum and lithium of $200 844 824.
World Resources and Production
Based on estimates published by the United States Geological Survey (USGS) and Geoscience Australia, the world resources of tantalum in 2012 totalled 156 kt. The world’s largest holder of tantalum resource is Brazil with an estimated 88 kt, followed by Australia with 60 kt and Canada and Ethiopia with 4 kt each.
Using USGS data, Geoscience Australia estimated world production of tantalum in 2012 to be 765 tonnes (767 tonnes in 2011). Production in 2012 was dominated by Mozambique, with 260 tonnes, which amounted to about 34% of world output. According to the USGS, other main producers were Brazil with 180 tonnes, Congo (Kinshasa) with 95 tonnes, Rwanda with 90 tonnes and Nigeria with 50 tonnes.
Copyright © 2013 Ferro-Alloys.Com. All Rights Reserved. Without permission, any unit and individual shall not copy or reprint!


 Save
Save Print
Print Daily News
 Research
 Magazine
 Company Database
 Customized Database
 Conferences
 Advertisement
 Trade
Trade


 Online inquiry
 Contact
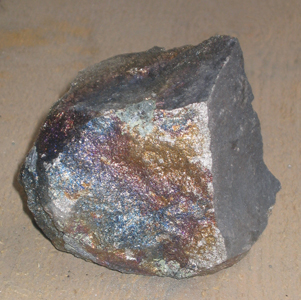


Tell Us What You Think